

TimeGPT requires time series data that doesn’t have any missing
values. It is possible to have multiple series that begin and end on
different dates, but it is essential that each series contains
uninterrupted data for its given time frame.
In this tutorial, we will show you how to deal with missing values in
TimeGPT.
Outline
- Load Data
- Get Started with TimeGPT
- Visualize Data
- Fill Missing Values
- Forecast with TimeGPT
- Important Considerations
- References
Load Data
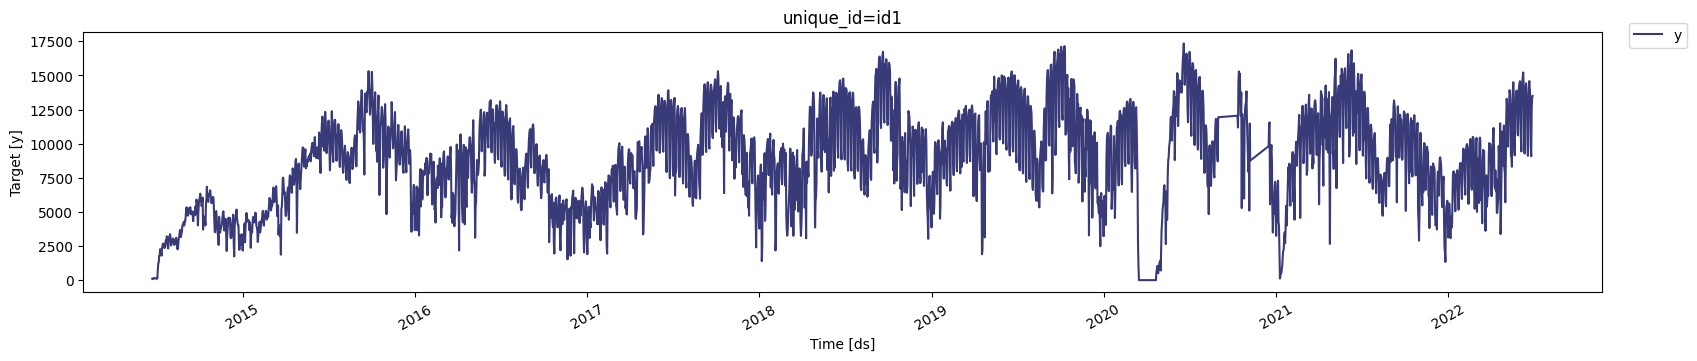
We will first load the data usingpandas. This dataset represents the
daily number of bike rentals in a city. The column names are in Spanish,
so we will rename them to ds for the dates and y for the number of
bike rentals.
| ds | y | |
|---|---|---|
| 0 | 2014-06-23 | 99 |
| 1 | 2014-06-24 | 72 |
| 2 | 2014-06-25 | 119 |
| 3 | 2014-06-26 | 135 |
| 4 | 2014-06-27 | 149 |
Get Started with TimeGPT
Before proceeding, we will instantiate theNixtlaClient
class, which provides access to all the methods from TimeGPT. To do
this, you will need a Nixtla API key.
👍 Use an Azure AI endpoint To use an Azure AI endpoint, set theTo learn more about how to set up your API key, please refer to the Setting Up Your API Key tutorial.base_urlargument:nixtla_client = NixtlaClient(base_url="you azure ai endpoint", api_key="your api_key")
Visualize Data
We can visualize the data using theplot method from the
NixtlaClient
class. This method has an engine argument that allows you to choose
between different plotting libraries. Default is matplotlib, but you
can also use plotly for interactive plots.
 Note that there are two gaps in the data: from September 1, 2020, to
October 10, 2020, and from November 8, 2020, to December 15, 2020. To
better visualize these gaps, you can use the
Note that there are two gaps in the data: from September 1, 2020, to
October 10, 2020, and from November 8, 2020, to December 15, 2020. To
better visualize these gaps, you can use the max_insample_length
argument of the plot method or you can simply zoom in on the plot.
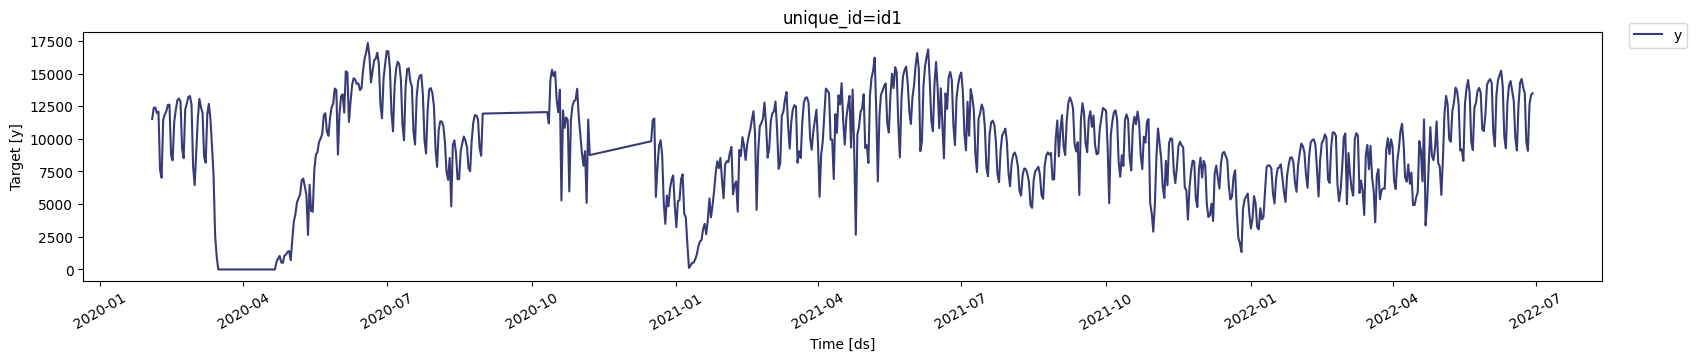 Additionally, notice a period from March 16, 2020, to April 21, 2020,
where the data shows zero rentals. These are not missing values, but
actual zeros corresponding to the COVID-19 lockdown in the city.
Additionally, notice a period from March 16, 2020, to April 21, 2020,
where the data shows zero rentals. These are not missing values, but
actual zeros corresponding to the COVID-19 lockdown in the city.
Fill Missing Values
Before usingTimeGPT, we need to ensure that:
- All timestamps from the start date to the end date are present in the data.
- The target column contains no missing values.
fill_gaps function from
utilsforecast,
a Python package from Nixtla that provides essential utilities for time
series forecasting, such as functions for data preprocessing, plotting,
and evaluation.
The fill_gaps function will fill in the missing dates in the data. To
do this, it requires the following arguments:
-
df: The DataFrame containing the time series data. -
freq(str or int): The frequency of the data.
NOTE: In this tutorial, the data contains only one time series. However, TimeGPT supports passing multiple series to the model. In this case, none of the time series can have missing values from their individual earliest timestamp until their individual lastest timestamp. If these individual time series have missing values, the user must decide how to fill these gaps for the individual time series. Thefill_gapsfunction provides a couple of additional arguments to assist with this (refer to the documentation for complete details), namelystartandend
source
fill_gaps
Enforce start and end datetimes for dataframe.
| Type | Default | Details | |
|---|---|---|---|
| df | DFType | Input data | |
| freq | Union | Series’ frequency | |
| start | Union | per_serie | Initial timestamp for the series. * ‘per_serie’ uses each serie’s first timestamp * ‘global’ uses the first timestamp seen in the data * Can also be a specific timestamp or integer, e.g. ‘2000-01-01’, 2000 or datetime(2000, 1, 1) |
| end | Union | global | Initial timestamp for the series. * ‘per_serie’ uses each serie’s last timestamp * ‘global’ uses the last timestamp seen in the data * Can also be a specific timestamp or integer, e.g. ‘2000-01-01’, 2000 or datetime(2000, 1, 1) |
| id_col | str | unique_id | Column that identifies each serie. |
| time_col | str | ds | Column that identifies each timestamp. |
| Returns | DFType | Dataframe with gaps filled. |
Forecast with TimeGPT
We are now ready to use theforecast method from the
NixtlaClient
class. This method requires the following arguments:
-
df: The DataFrame containing the time series data -
h: (int) The forecast horizon. In this case, it is 93 days. -
model(str): The model to use. Default istimegpt-1, but since the forecast horizon exceeds the frequency of the data (daily), we will usetimegpt-1-long-horizon. To learn more about this, please refer to the Forecasting on a Long Horizon tutorial.
📘 Available models in Azure AI If you are using an Azure AI endpoint, please be sure to setWe can use themodel="azureai":nixtla_client.forecast(..., model="azureai")For the public API, we support two models:timegpt-1andtimegpt-1-long-horizon. By default,timegpt-1is used. Please see this tutorial on how and when to usetimegpt-1-long-horizon.
plot method to visualize the TimeGPT forecast and the
test set.
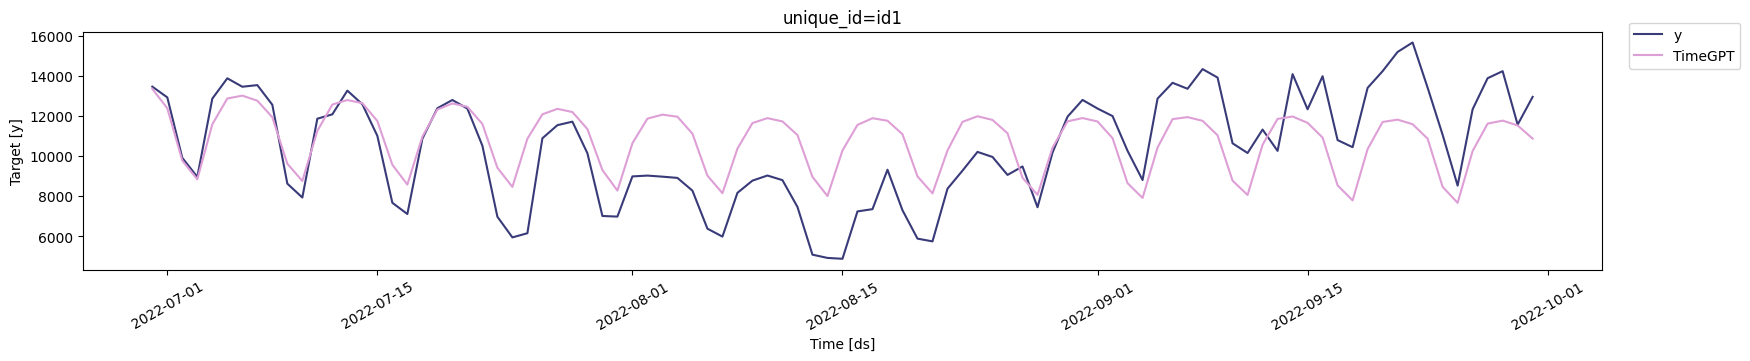 Next, we will use the
 evaluate function from utilsforecast to
compute the Mean Average Error (MAE) of the TimeGPT forecast. Before
proceeding, we need to convert the dates in the forecast to timestamps
so we can merge them with the test set.
The evaluate function requires the following arguments:
-
df: The DataFrame containing the forecast and the actual values (in theycolumn). -
metrics(list): The metrics to be computed.
| unique_id | ds | y | TimeGPT | |
|---|---|---|---|---|
| 0 | id1 | 2022-06-30 | 13468 | 13357.357 |
| 1 | id1 | 2022-07-01 | 12932 | 12390.052 |
| 2 | id1 | 2022-07-02 | 9918 | 9778.649 |
| 3 | id1 | 2022-07-03 | 8967 | 8846.637 |
| 4 | id1 | 2022-07-04 | 12869 | 11589.071 |
| unique_id | metric | TimeGPT | |
|---|---|---|---|
| 0 | id1 | mae | 1824.693059 |
Important Considerations
The key takeaway from this tutorial is thatTimeGPT requires time
series data without missing values. This means that:
- Given the frequency of the data, the timestamps must be continuous, with no gaps between the start and end dates.
- The data must not contain missing values (NaNs).
utilsforecast provides a convenient function to
fill missing dates and that you need to decide how to address the
missing values. This decision depends on the context of your data, so be
mindful when selecting a filling strategy, and choose the one you think
best reflects reality.
Finally, we also demonstrated that utilsforecast provides a function
to evaluate the TimeGPT forecast using common accuracy metrics.
References