

1. Import packages
First, we import the required packages and initialize the Nixtla client.👍 Use an Azure AI endpoint To use an Azure AI endpoint, set thebase_urlargument:nixtla_client = NixtlaClient(base_url="you azure ai endpoint", api_key="your api_key")
2. Load data
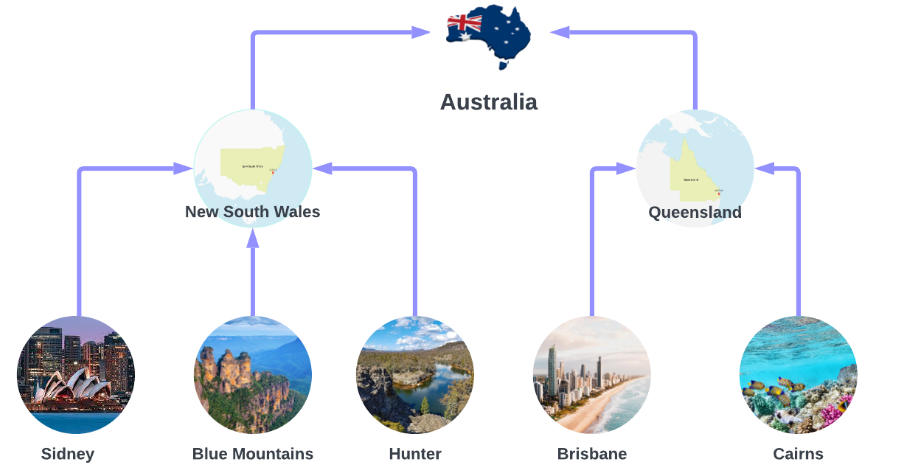
We use the Australian Tourism dataset, from Forecasting, Principles and Practices which contains data on Australian Tourism. We are interested in forecasts for Australia’s 7 States, 27 Zones and 76 Regions. This constitutes a hierarchy, where forecasts for the lower levels (e.g. the regions Sidney, Blue Mountains and Hunter) should be coherent with the forecasts of the higher levels (e.g. New South Wales).
 The dataset only contains the time series at the lowest level, so we
need to create the time series for all hierarchies.
The dataset only contains the time series at the lowest level, so we
need to create the time series for all hierarchies.
| Country | Region | State | Purpose | ds | y | |
|---|---|---|---|---|---|---|
| 0 | Australia | Adelaide | South Australia | Business | 1998-01-01 | 135.077690 |
| 1 | Australia | Adelaide | South Australia | Business | 1998-04-01 | 109.987316 |
| 2 | Australia | Adelaide | South Australia | Business | 1998-07-01 | 166.034687 |
| 3 | Australia | Adelaide | South Australia | Business | 1998-10-01 | 127.160464 |
| 4 | Australia | Adelaide | South Australia | Business | 1999-01-01 | 137.448533 |
| 5 | Australia | Adelaide | South Australia | Business | 1999-04-01 | 199.912586 |
| 6 | Australia | Adelaide | South Australia | Business | 1999-07-01 | 169.355090 |
| 7 | Australia | Adelaide | South Australia | Business | 1999-10-01 | 134.357937 |
| 8 | Australia | Adelaide | South Australia | Business | 2000-01-01 | 154.034398 |
| 9 | Australia | Adelaide | South Australia | Business | 2000-04-01 | 168.776364 |
aggregate function from HierarchicalForecast we can get
the full set of time series.
Note You can installhierarchicalforecastwithpip:
| unique_id | ds | y | |
|---|---|---|---|
| 0 | Australia | 1998-01-01 | 23182.197269 |
| 1 | Australia | 1998-04-01 | 20323.380067 |
| 2 | Australia | 1998-07-01 | 19826.640511 |
| 3 | Australia | 1998-10-01 | 20830.129891 |
| 4 | Australia | 1999-01-01 | 22087.353380 |
| 5 | Australia | 1999-04-01 | 21458.373285 |
| 6 | Australia | 1999-07-01 | 19914.192508 |
| 7 | Australia | 1999-10-01 | 20027.925640 |
| 8 | Australia | 2000-01-01 | 22339.294779 |
| 9 | Australia | 2000-04-01 | 19941.063482 |
3. Hierarchical forecasting with TimeGPT
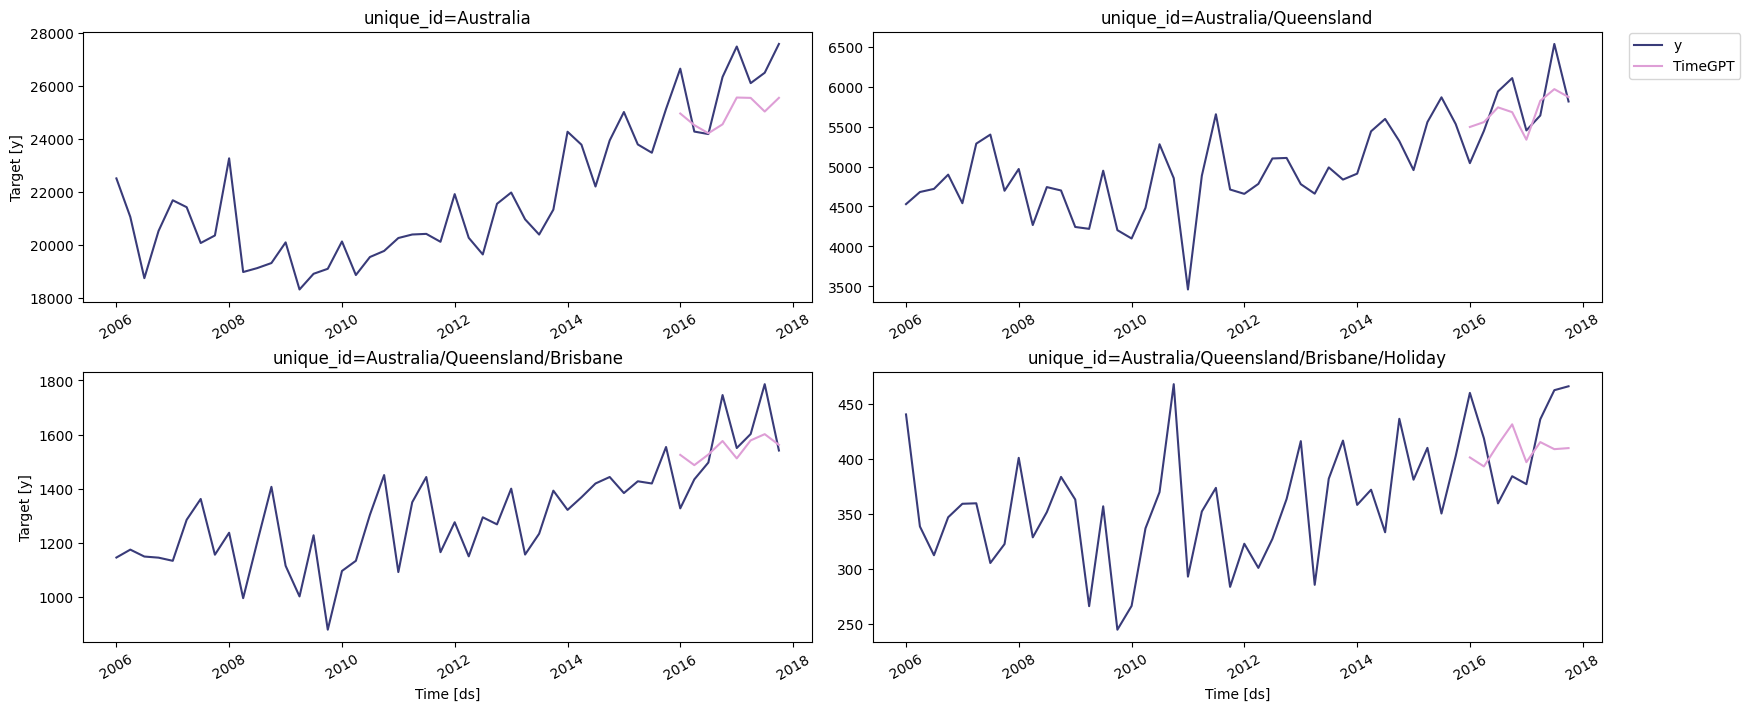
First, we create base forecasts for all the time series with TimeGPT. Note that we setadd_history=True, as we will need the in-sample
fitted values of TimeGPT.
We will predict 2 years (8 quarters), starting from 01-01-2016.
📘 Available models in Azure AI If you are using an Azure AI endpoint, please be sure to setmodel="azureai":nixtla_client.forecast(..., model="azureai")For the public API, we support two models:timegpt-1andtimegpt-1-long-horizon. By default,timegpt-1is used. Please see this tutorial on how and when to usetimegpt-1-long-horizon.
Australia), to the lowest level
(Australia/Queensland/Brisbane/Holiday). We can see that there is room
for improvement in the forecasts.
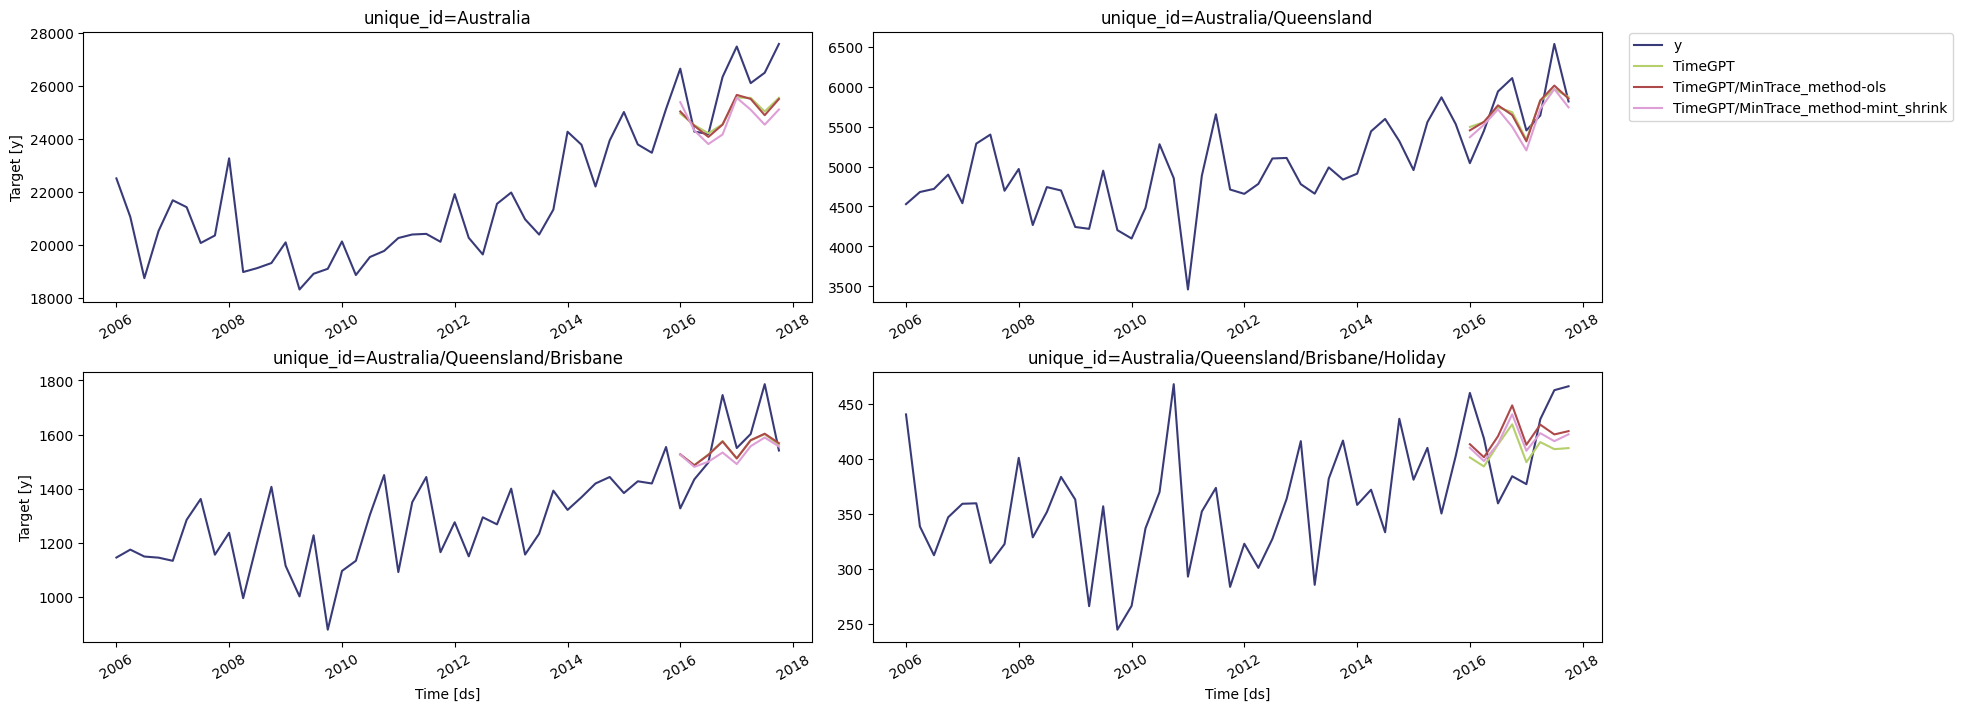
 We can make these forecasts coherent to the specified hierarchy by using
a
We can make these forecasts coherent to the specified hierarchy by using
a HierarchicalReconciliation method from NeuralForecast. We will be
using the
MinTrace
method.
| unique_id | ds | TimeGPT | TimeGPT/MinTrace_method-ols | TimeGPT/MinTrace_method-mint_shrink | |
|---|---|---|---|---|---|
| 0 | Australia | 2016-01-01 | 24967.19100 | 25044.408634 | 25394.406211 |
| 1 | Australia | 2016-04-01 | 24528.88300 | 24503.089810 | 24327.212355 |
| 2 | Australia | 2016-07-01 | 24221.77500 | 24083.107812 | 23813.826553 |
| 3 | Australia | 2016-10-01 | 24559.44000 | 24548.038797 | 24174.894203 |
| 4 | Australia | 2017-01-01 | 25570.33800 | 25669.248281 | 25560.277473 |
| … | … | … | … | … | … |
| 3395 | Australia/Western Australia/Experience Perth/V… | 2016-10-01 | 427.81146 | 435.423617 | 434.047102 |
| 3396 | Australia/Western Australia/Experience Perth/V… | 2017-01-01 | 450.71786 | 453.434056 | 459.954598 |
| 3397 | Australia/Western Australia/Experience Perth/V… | 2017-04-01 | 452.17923 | 460.197847 | 470.009789 |
| 3398 | Australia/Western Australia/Experience Perth/V… | 2017-07-01 | 450.68683 | 463.034888 | 482.645932 |
| 3399 | Australia/Western Australia/Experience Perth/V… | 2017-10-01 | 443.31050 | 451.754435 | 474.403379 |
 Let’s numerically verify the forecasts to the situation where we don’t
apply a post-processing step. We can use
Let’s numerically verify the forecasts to the situation where we don’t
apply a post-processing step. We can use HierarchicalEvaluation for
this.
| level | metric | TimeGPT | TimeGPT/MinTrace_method-ols | TimeGPT/MinTrace_method-mint_shrink | |
|---|---|---|---|---|---|
| 0 | Total | rmse | 1433.07 | 1436.07 | 1627.43 |
| 1 | Purpose | rmse | 482.09 | 475.64 | 507.50 |
| 2 | State | rmse | 275.85 | 278.39 | 294.28 |
| 3 | Regions | rmse | 49.40 | 47.91 | 47.99 |
| 4 | Bottom | rmse | 19.32 | 19.11 | 18.86 |
| 5 | Overall | rmse | 38.66 | 38.21 | 39.16 |
MinTrace(ols), and made them slightly worse using
MinTrace(mint_shrink), indicating that the base forecasts were
relatively strong already.
However, we now have coherent forecasts too - so not only did we make a
(small) accuracy improvement, we also got coherency to the hierarchy as
a result of our reconciliation step.
References