Step 1: Set up a TimeGEN-1 endpoint account and generate your API key on Azure
- Go to ml.azure.com
- Sign in or create an account at Microsoft
- Click on ‘Models’ in the sidebar
- Search for ‘TimeGEN’ in the model catalog
- Select TimeGEN-1
- Click ‘Deploy’ and this will create an Endpoint
- Go to ‘Endpoint’ in the sidebar and you will see your TimeGEN-1 endpoint there
- In that Endpoint are the base URL and API Key you will use
Step 2: Install Nixtla
In your favorite Python development environment: Installnixtla with pip:
Step 3: Import the Nixtla TimeGPT client
NixtlaClient
class providing your authentication API key.
Step 4: Start making forecasts!
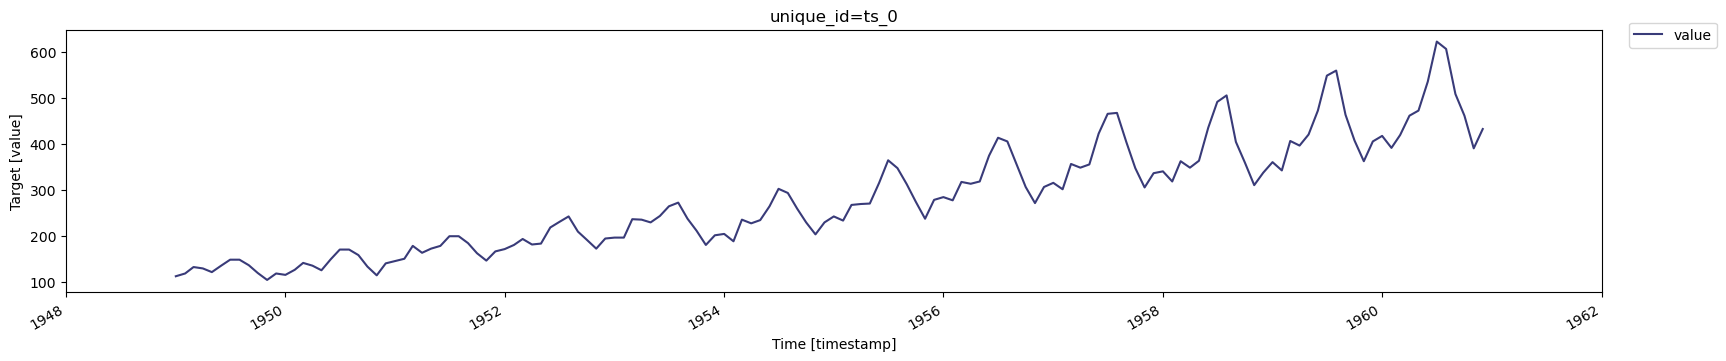
Now you can start making forecasts! Let’s import an example using the classicAirPassengers dataset. This dataset contains the monthly
number of airline passengers in Australia between 1949 and 1960. First,
load the dataset and plot it:
| timestamp | value | |
|---|---|---|
| 0 | 1949-01-01 | 112 |
| 1 | 1949-02-01 | 118 |
| 2 | 1949-03-01 | 132 |
| 3 | 1949-04-01 | 129 |
| 4 | 1949-05-01 | 121 |
📘 Data RequirementsFor further details go to Data Requirements.
- Make sure the target variable column does not have missing or non-numeric values.
- Do not include gaps/jumps in the datestamps (for the given frequency) between the first and late datestamps. The forecast function will not impute missing dates.
- The format of the datestamp column should be readable by Pandas (see this link for more details).
👍 Save figures made with TimeGEN Theplotmethod automatically displays figures when in a notebook environment. To save figures locally, you can do:fig = nixtla_client.plot(df, time_col='timestamp', target_col='value')fig.savefig('plot.png', bbox_inches='tight')
Make forecasts
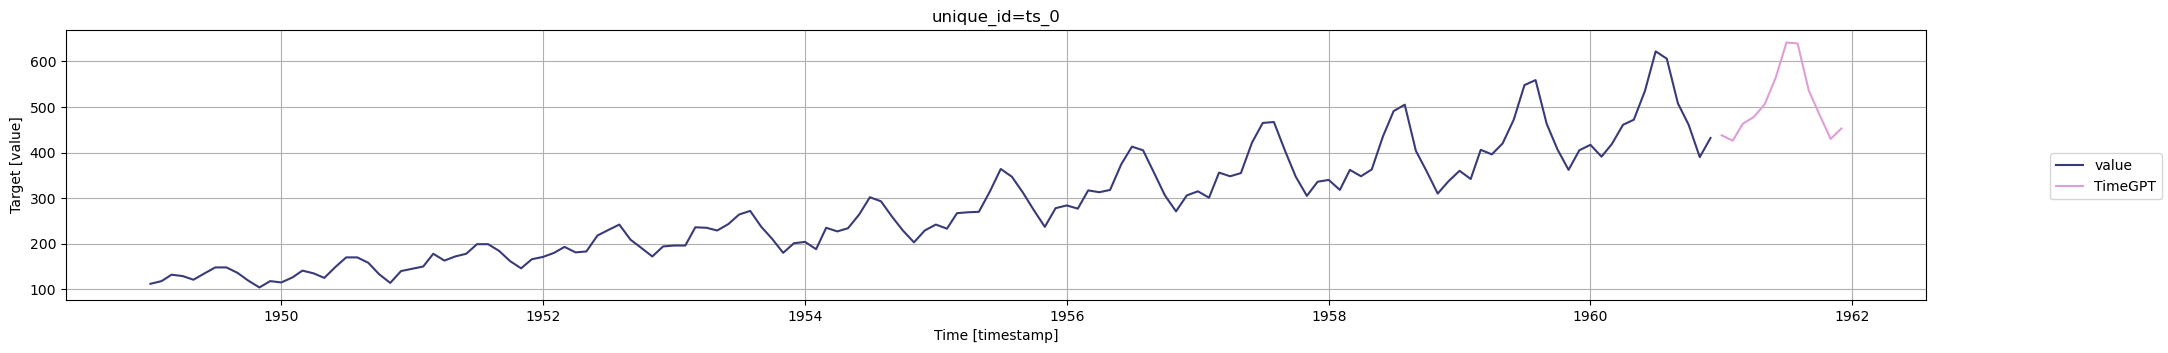
Next, forecast the next 12 months using the SDKforecast method. Set
the following parameters:
df: A pandas DataFrame containing the time series data.h: Horizons is the number of steps ahead to forecast.freq: The frequency of the time series in Pandas format. See pandas’ available frequencies. (If you don’t provide any frequency, the SDK will try to infer it)time_col: The column that identifies the datestamp.target_col: The variable to forecast.
| timestamp | TimeGPT | |
|---|---|---|
| 0 | 1961-01-01 | 437.837921 |
| 1 | 1961-02-01 | 426.062714 |
| 2 | 1961-03-01 | 463.116547 |
| 3 | 1961-04-01 | 478.244507 |
| 4 | 1961-05-01 | 505.646484 |