

1. Import packages
First, we install and import the required packages and initialize the Nixtla client. As always, we start off by intializing an instance ofNixtlaClient.
👍 Use an Azure AI endpoint To use an Azure AI endpoint, remember to set also thebase_urlargument:nixtla_client = NixtlaClient(base_url="you azure ai endpoint", api_key="your api_key")
2. Load the data
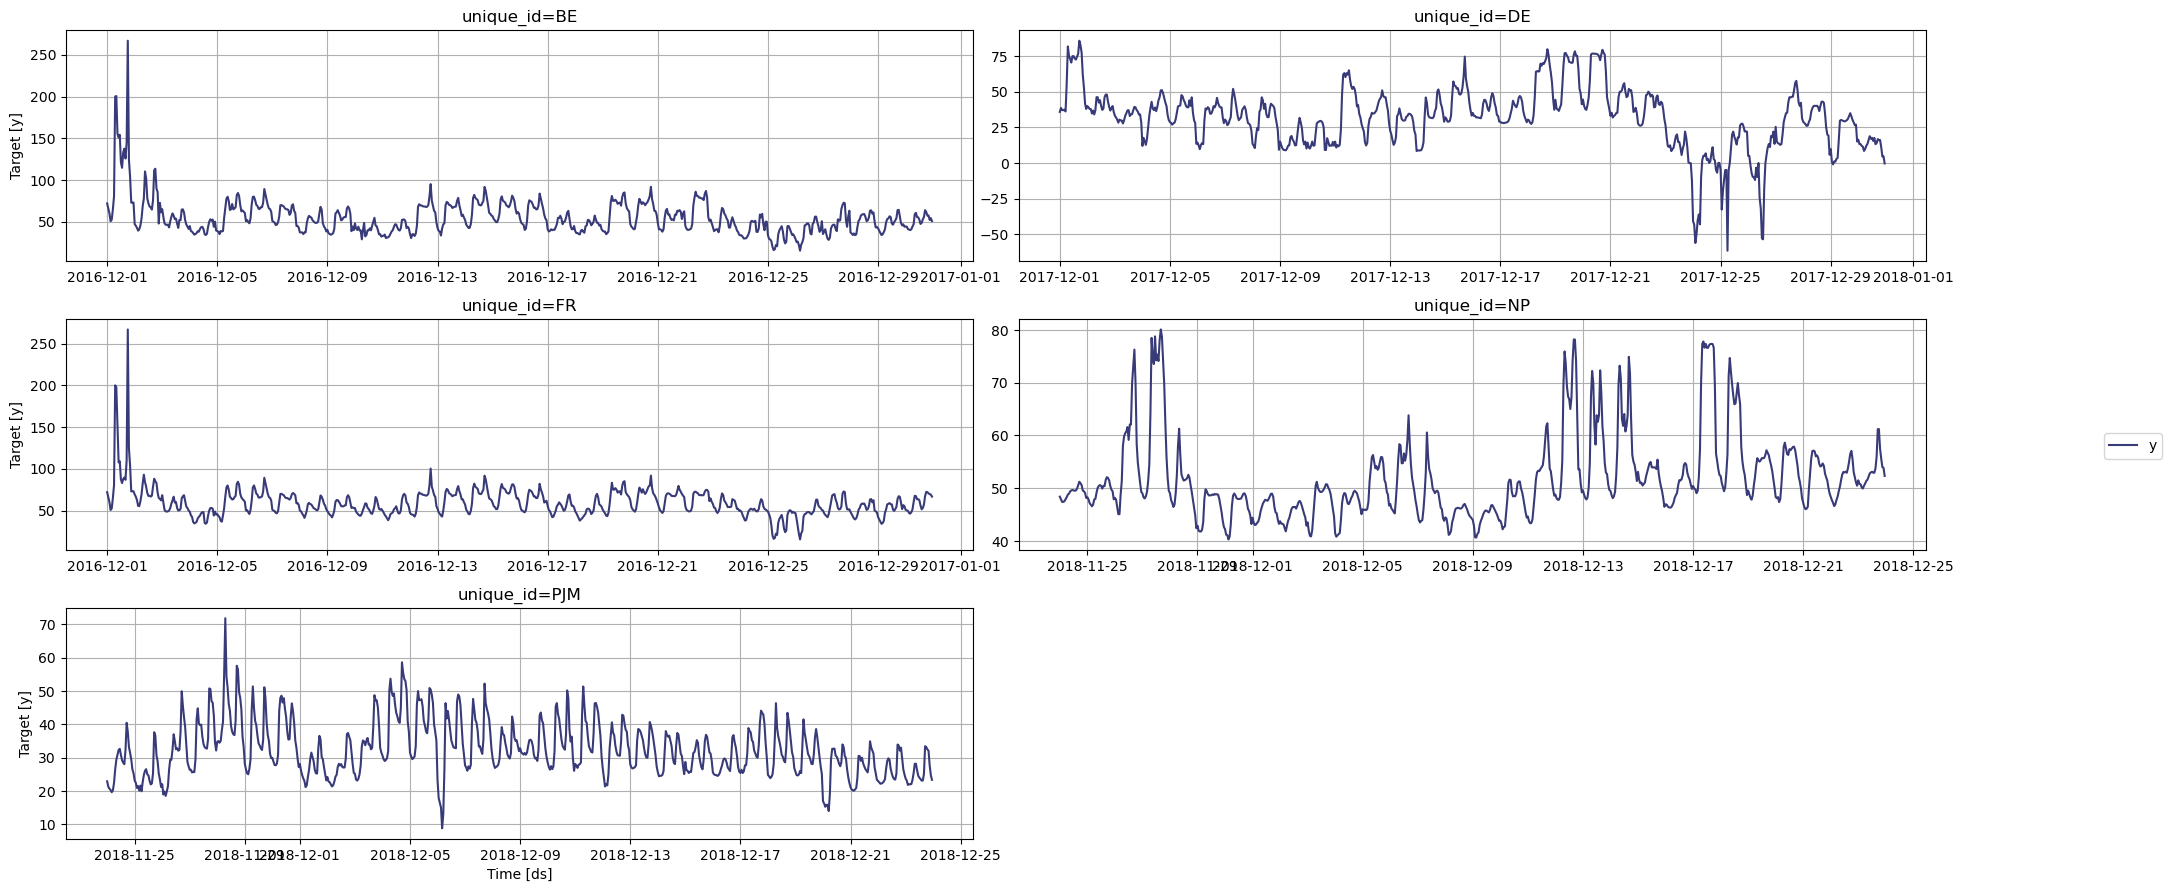
The following dataset contains prices of different electricity markets in Europe. Mutliple series are automatically detected in TimeGPT using theunique_id column. This column contains labels for each series. If
there are multiple unique values in that column, then it knows it is
handling a multi-series scneario.
In this particular case, the unique_id column contains the value BE,
DE, FR, JPM, and NP.
| unique_id | ds | y | |
|---|---|---|---|
| 0 | BE | 2016-12-01 00:00:00 | 72.00 |
| 1 | BE | 2016-12-01 01:00:00 | 65.80 |
| 2 | BE | 2016-12-01 02:00:00 | 59.99 |
| 3 | BE | 2016-12-01 03:00:00 | 50.69 |
| 4 | BE | 2016-12-01 04:00:00 | 52.58 |
NixtlaClient](src/nixtla_client.html#nixtlaclient):
3. Forecasting Multiple Series
To forecast all series at once, we simply pass the dataframe to thedf
argument. TimeGPt will automatically forecast all series.
| unique_id | ds | TimeGPT | TimeGPT-lo-90 | TimeGPT-lo-80 | TimeGPT-hi-80 | TimeGPT-hi-90 | |
|---|---|---|---|---|---|---|---|
| 0 | BE | 2016-12-31 00:00:00 | 46.151176 | 36.660478 | 38.337019 | 53.965334 | 55.641875 |
| 1 | BE | 2016-12-31 01:00:00 | 42.426598 | 31.602231 | 33.976724 | 50.876471 | 53.250964 |
| 2 | BE | 2016-12-31 02:00:00 | 40.242889 | 30.439970 | 33.634985 | 46.850794 | 50.045809 |
| 3 | BE | 2016-12-31 03:00:00 | 38.265339 | 26.841481 | 31.022093 | 45.508585 | 49.689197 |
| 4 | BE | 2016-12-31 04:00:00 | 36.618801 | 18.541384 | 27.981346 | 45.256256 | 54.696218 |
📘 Available models in Azure AI If you are using an Azure AI endpoint, please be sure to setmodel="azureai":nixtla_client.forecast(..., model="azureai")For the public API, we support two models:timegpt-1andtimegpt-1-long-horizon. By default,timegpt-1is used. Please see this tutorial on how and when to usetimegpt-1-long-horizon.
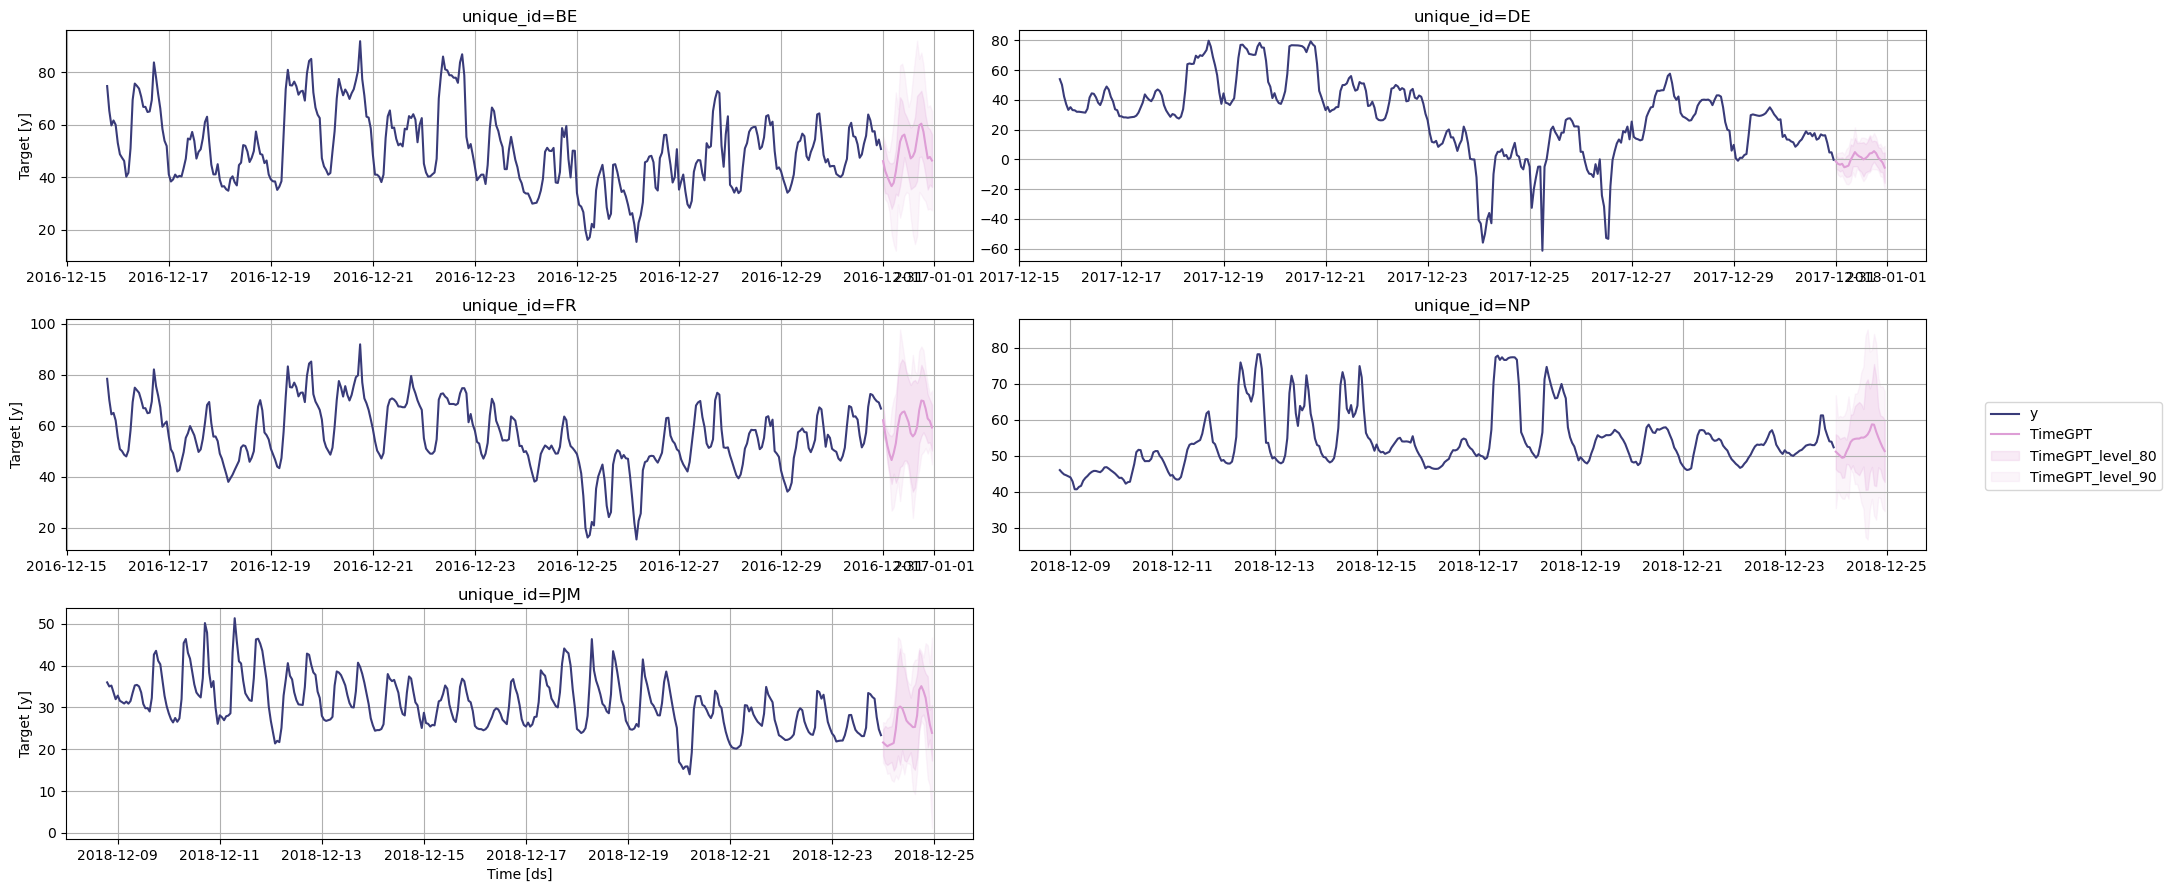 From the figure above, we can see that the model effectively generated
predictions for each unique series in the dataset.
From the figure above, we can see that the model effectively generated
predictions for each unique series in the dataset.
Historical forecast
You can also compute prediction intervals for historical forecasts adding theadd_history=True.
To specify the confidence interval, we use the level argument. Here,
we pass the list [80, 90]. This will compute a 80% and 90% confidence
interval.
| unique_id | ds | TimeGPT | TimeGPT-lo-80 | TimeGPT-lo-90 | TimeGPT-hi-80 | TimeGPT-hi-90 | |
|---|---|---|---|---|---|---|---|
| 0 | BE | 2016-12-06 00:00:00 | 55.756332 | 42.066476 | 38.185593 | 69.446188 | 73.327072 |
| 1 | BE | 2016-12-06 01:00:00 | 52.820206 | 39.130350 | 35.249466 | 66.510062 | 70.390946 |
| 2 | BE | 2016-12-06 02:00:00 | 46.851070 | 33.161214 | 29.280331 | 60.540926 | 64.421810 |
| 3 | BE | 2016-12-06 03:00:00 | 50.640892 | 36.951036 | 33.070152 | 64.330748 | 68.211632 |
| 4 | BE | 2016-12-06 04:00:00 | 52.420410 | 38.730554 | 34.849670 | 66.110266 | 69.991150 |
📘 Available models in Azure AI If you are using an Azure AI endpoint, please be sure to setmodel="azureai":nixtla_client.forecast(..., model="azureai")For the public API, we support two models:timegpt-1andtimegpt-1-long-horizon. By default,timegpt-1is used. Please see this tutorial on how and when to usetimegpt-1-long-horizon.
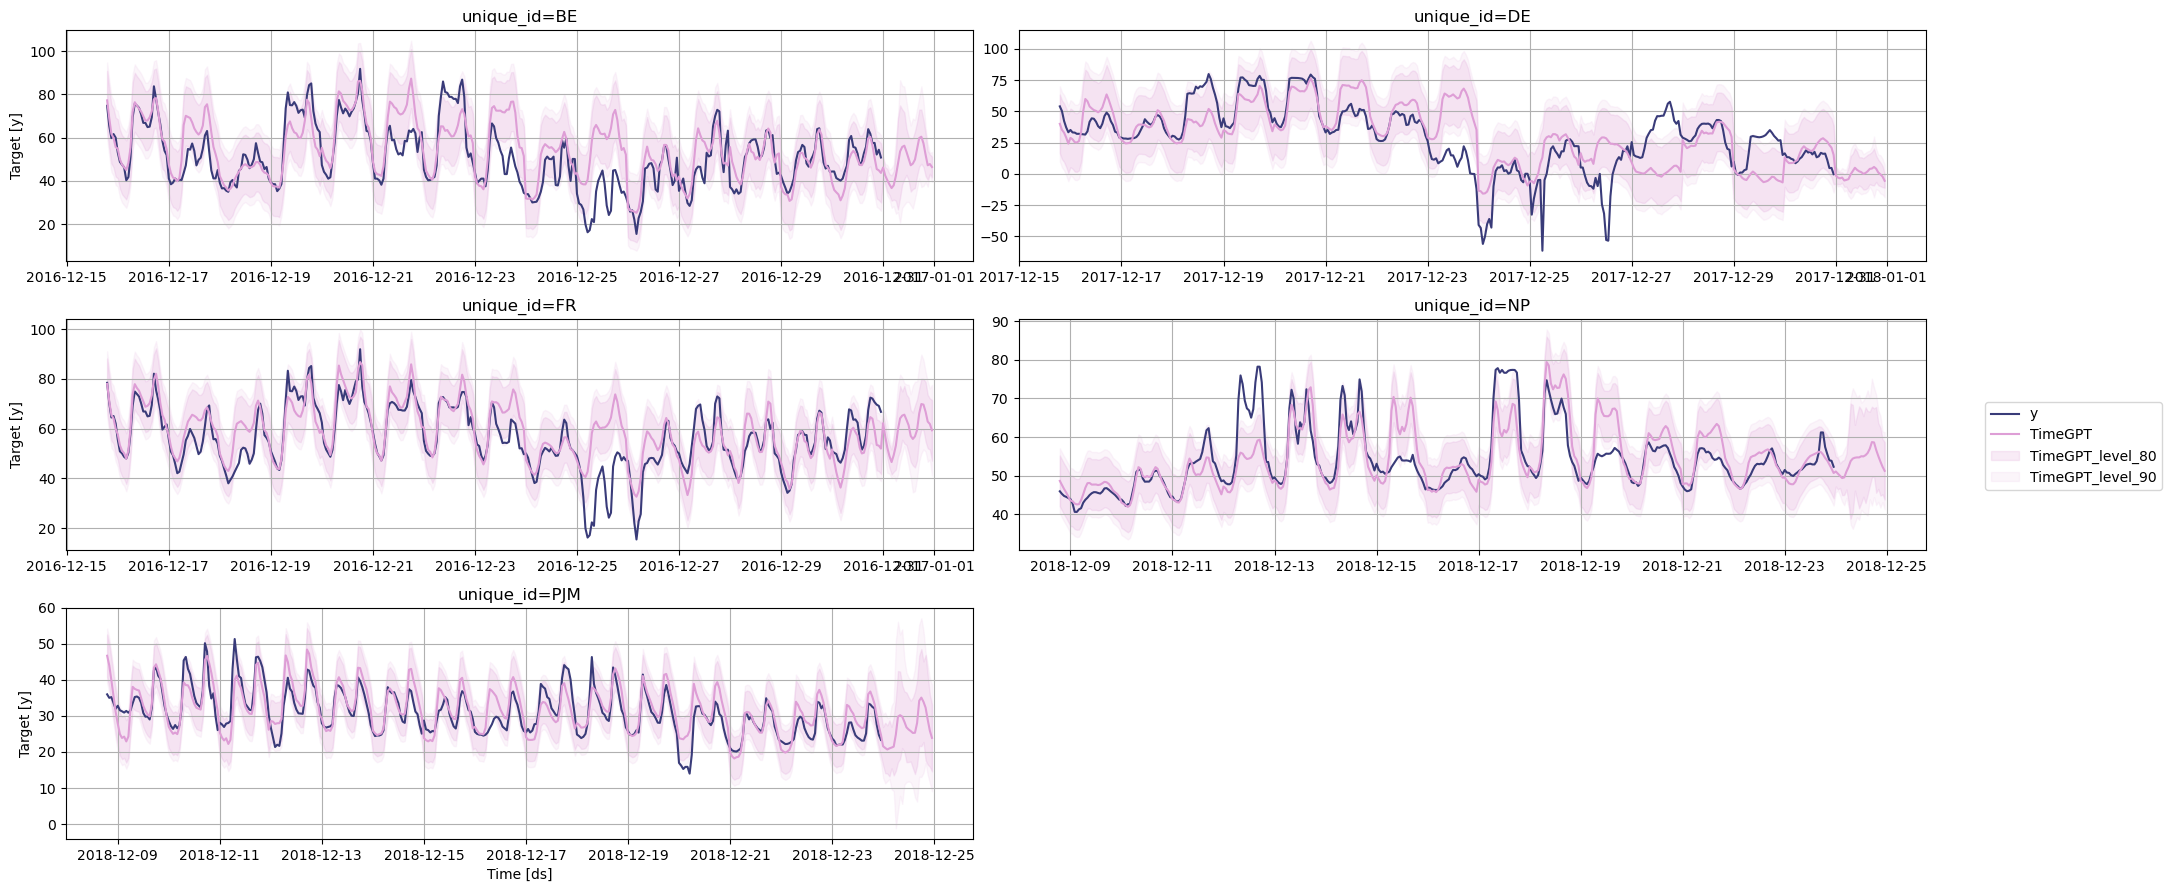 In the figure above, we now see the historical predictions made by
TimeGPT for each series, along with the 80% and 90% confidence
intervals.
In the figure above, we now see the historical predictions made by
TimeGPT for each series, along with the 80% and 90% confidence
intervals.